How important are age and experience to winning in hockey?

One of the most fascinating things about modern sports is how much easier it has become to quantify different aspects of the game. Whether you enjoy stats or not, information about most facets of sports is at an all-time high.
However, element that hasn’t been quantified yet is the impact of age, experience and leadership on a team. It’s often talked about as a valuable part of building a team and is very essential to winning. In theory, you want to have players who have experienced the highs and the lows of a season and can guide the rest of the team through those moments, as well as teach the younger players how to be better at the sport.
There’s no denying the importance of experience. Whether you’re playing on a sports team or just managing a workplace, having older members that know the ins and outs can be very helpful in avoiding future mistakes.
But at the same time, those older players come with a downside. There’s been a lot of talk about aging curves in sports, and how in the modern era, players tend to start to hit their decline before they even hit 30, never mind their late 30s or 40s. Obviously, there are exceptions, but the average player will see their play drop off once they hit their 30s unless they’re the best of the best.
In fact, only 24 of the top 100 NHL players in goals above replacement were 30 or older last season. That’s still a decent amount of players, but a majority of them still find themselves in their 20s.
So with that comes a double-edged sword when recruiting veterans for your team. On one hand, they provide you with the experience to guide you when it’s needed, but on the other hand, they might not provide the kind of on-ice play that you would hope for to be successful and it may hold back the team. So, how much does it help you win? Let’s take a look.
First, I decided to look at the past five seasons in the NHL, and compare the average age of each team to how well they performed in the regular season.
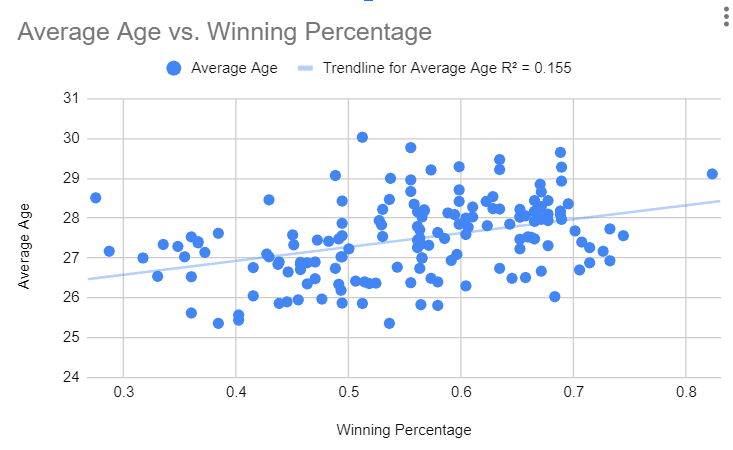
Based on the data, this chart really lives up to the name “scatter plot,” as it is mostly just points scattered across the chart. I also provided the correlation line; the upward slant would indicate there is a bit of a positive trend towards older players being a part of winning teams, but the correlation coefficient being just 0.155 indicates very little correlation.
Of course, the thing with looking at just wins is that there is a lot of random variance that goes towards wins. High shooting percentages, goaltenders playing above their heads, and getting the bounces in one-goal games can all contribute to wins that don’t paint the full picture of the team. So, I decided to also look at the average age of these teams in relation to how successful those teams were at driving expected goals at 5v5.
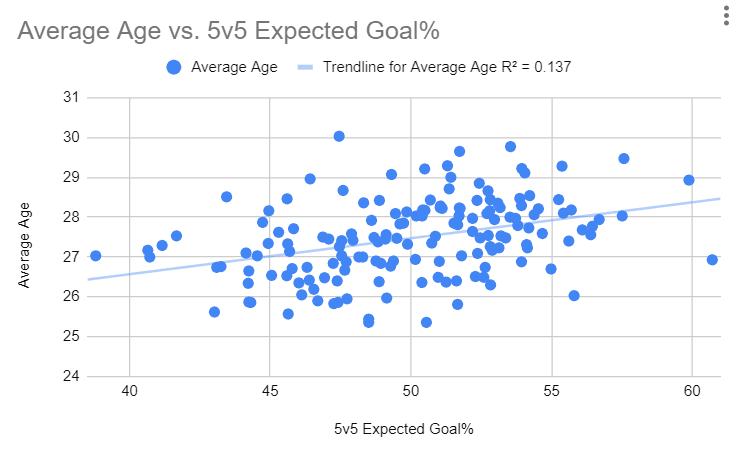
Much like how age relates to winning percentage, there isn’t much of a correlation between age and a team’s ability to drive chances. In fact, there’s slightly less correlation, with the correlation coefficient being nearly 0.02 lower. Again, the positive slope indicates some kind of a trend, but when the correlation is that low, it’s mostly just noise.
So instead of looking at the whole team, what about just focusing on the team’s best players. Sometimes you can have a team with a core of elite talent in their 20s that does most of the work surrounded by a group of older players (like the 2023-24 Edmonton Oilers), and you can also have a team on which the best contributors are older players who are past their prime (like the 2023-24 Pittsburgh Penguins).
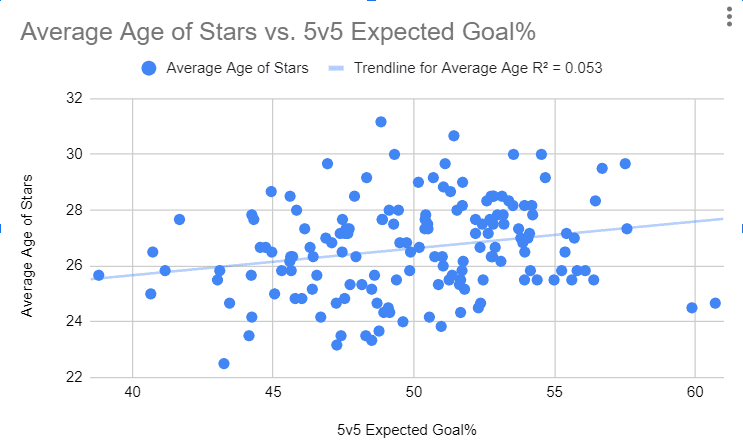
With that in mind, I decided to take a look at the average age of each team’s five best players and best goaltender in the past five seasons, based on the players’ GAR in those respective seasons.
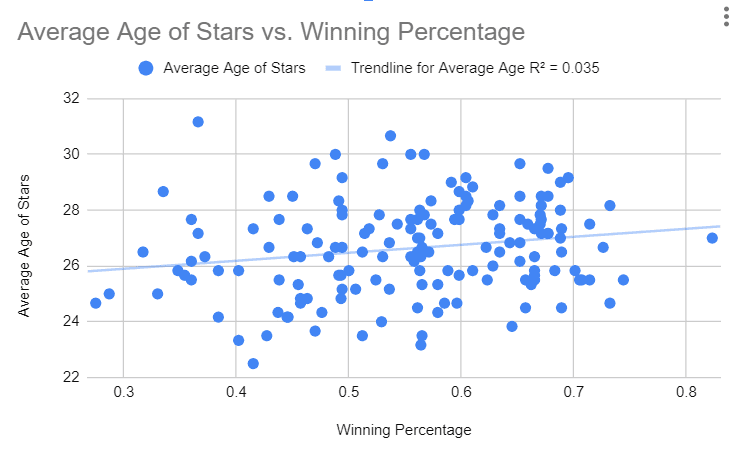
Not only is there no correlation like with the average age of the entire team, it’s actually even worse. The correlation coefficient is just 0.035, implying almost no correlation even with a positive trendline. It doesn’t get much better when you look at its relation to 5v5 expected goal share, which has a correlation coefficient of 0.053.
Well, what about if we look at teams that went far in the playoffs? How do they compare to the rest of the league in terms of their average age, since we know they can get results?
| Team | Average Age | League Rank that season | Average Age of Stars | League Rank that season |
| 2019-20 Tampa Bay Lightning | 28.06 | t-26th | 25.5 | t-15th |
| 2019-20 Dallas Stars | 28.09 | 28th | 27.67 | t-28th |
| 2019-20 New York Islanders | 28.13 | 29th | 25.83 | t-17th |
| 2019-20 Vegas Golden Knights | 27.77 | 22nd | 28.33 | 30th |
| 2020-21 Tampa Bay Lightning | 28.24 | 26th | 27.83 | t-23rd |
| 2020-21 Montreal Canadiens | 27.94 | 23rd | 27.83 | t-23rd |
| 2020-21 New York Islanders | 29.22 | 30th | 26.5 | t-13th |
| 2020-21 Vegas Golden Knights | 27.73 | 21st | 28.17 | 27th |
| 2021-22 Colorado Avalanche | 27.17 | 14th | 26.67 | 12th |
| 2021-22 Tampa Bay Lightning | 28.66 | 30th | 28.5 | t-24th |
| 2021-22 Edmonton Oilers | 28.23 | 27th | 28.17 | 22nd |
| 2021-22 New York Rangers | 26.67 | 8th | 27.17 | t-13th |
| 2022-23 Vegas Golden Knights | 28.44 | 26th | 28.5 | 27th |
| 2022-23 Florida Panthers | 27.79 | 19th | 27 | t-17th |
| 2022-23 Dallas Stars | 27.53 | 16th | 27.5 | 22nd |
| 2022-23 Carolina Hurricanes | 28.93 | 28th | 24.5 | 3rd |
| 2023-24 Florida Panthers | 28.29 | 22nd | 28.17 | t-25th |
| 2023-24 Edmonton Oilers | 29.5 | 32nd | 27.33 | t-17th |
| 2023-24 New York Rangers | 28.36 | 23rd | 29.17 | t-27th |
| 2023-24 Dallas Stars | 29.28 | 31st | 26.5 | t-13th |
There is a bit more of a trend here. It appears that most teams that have made the Conference Finals tend to be in the older half of the league, with only three teams ranking in the younger half. There’s a few more when it comes to the average age of their best players (6), but it does seem like the teams that win in the playoffs tend to have older lineups. That said, outside of all three Vegas Golden Knights teams and both of the New York Rangers teams to make the Conference Finals, all the teams that make it far tend to have a group of star players that are younger on average than the entire team.
So, there’s a bit of a trend in terms of teams that are successful in the playoffs, but what is there to learn from this? If an argument I’m trying to solve has little correlation, it feels like there’s nothing to learn, but there is one thing. I’ll leave you with one more chart of the two stats we’ve used so far that we haven’t compared.
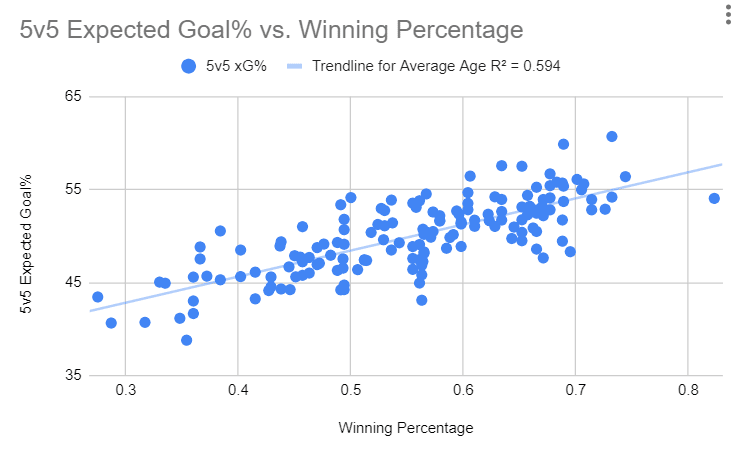
As it turns out, the two stats we’ve been trying to use to correlate with the age and experience of teams are the ones that correlate together. Teams that drive play well generally tend to win (which is why I place such an emphasis on using these kinds of stats in most of my work). It’s not universal, but a correlation coefficient of 0.594 indicates moderate to high correlation.
So what’s the lesson? Prioritize skill over age. Play your best players, and you’ll probably win. Don’t use experience as a tiebreaker between a rookie and a veteran if the rookie has more skill and translates that to on-ice results. But if a rookie isn’t getting results either, and the veteran is better, go for the vet, don’t just play the young player because he has potential.
If you want to develop your young guys by playing them, or develop your team by letting them work with experienced players, then obviously prioritize a certain archetype. But if you just want to win, play your best players.
_____
Article presented by Fountain Tire

At Fountain Tire, you don’t have to choose between a good deal or excellent service—they offer both. They treat your vehicle like their own, providing detailed inspections, photos, and updates on what’s fine, what needs attention, and what can wait. Offering top-quality tires and products from brands like Goodyear, safety is their top priority. Every visit ensures you’re as safe as possible on the road. If you need new tires, or your vehicle’s making a funny noise, stop by Fountain Tire. They’ll take care of it, or you can book an appointment online at www.fountaintire.com
_____